Precision Agriculture Mapping
The Food and Agriculture Organization (FAO) of the United Nations, the world’s population will reach 9.1 billion, 34 percent higher than today’s population, by 2050. Due to this expected growth, there is pressure worldwide for higher agricultural production and reliable crop status information.
To achieve these objectives, improved management of the world’s agricultural resources is required, especially in developing countries.
Utilizing high-resolution, multispectral satellite or aerial imagery and Artificial Intelligence (AI), Machine Learning (ML), and Computer Vision (CV) algorithms, image data is collected and transferred into management solutions for crop health and improved production targets.
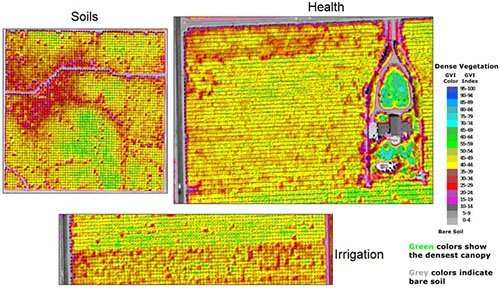
Vegetation Index Maps
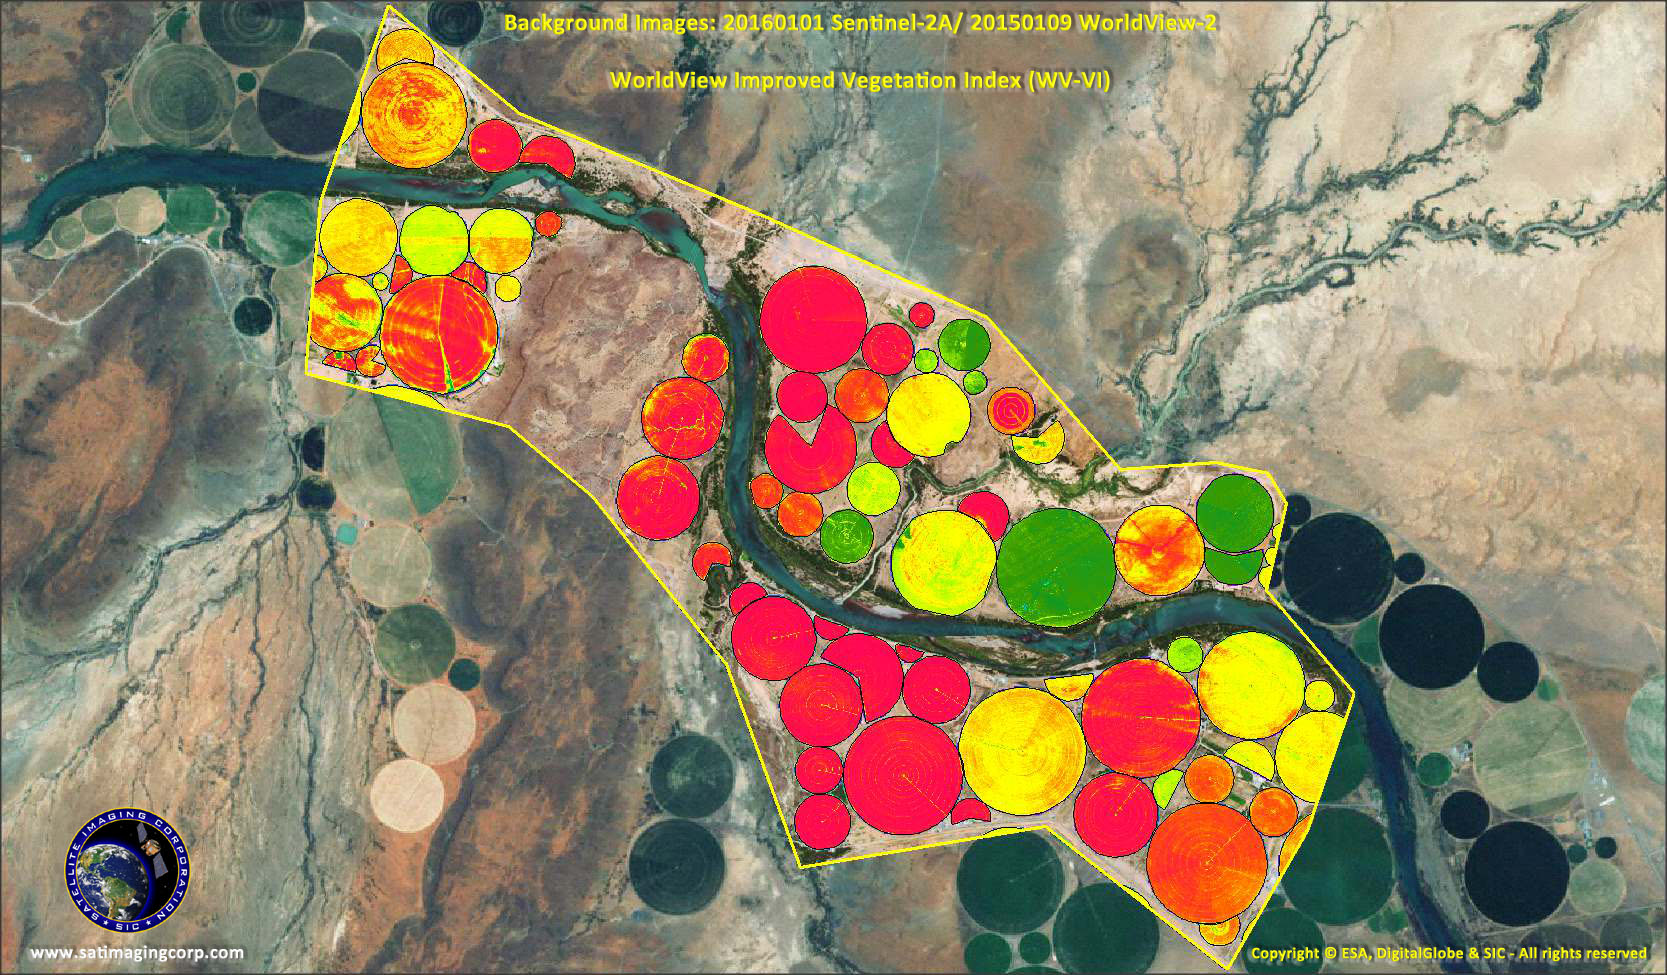
WorldView-2 MS 1.6m Vegetation Index (WV-VI) 20150109
South Africa
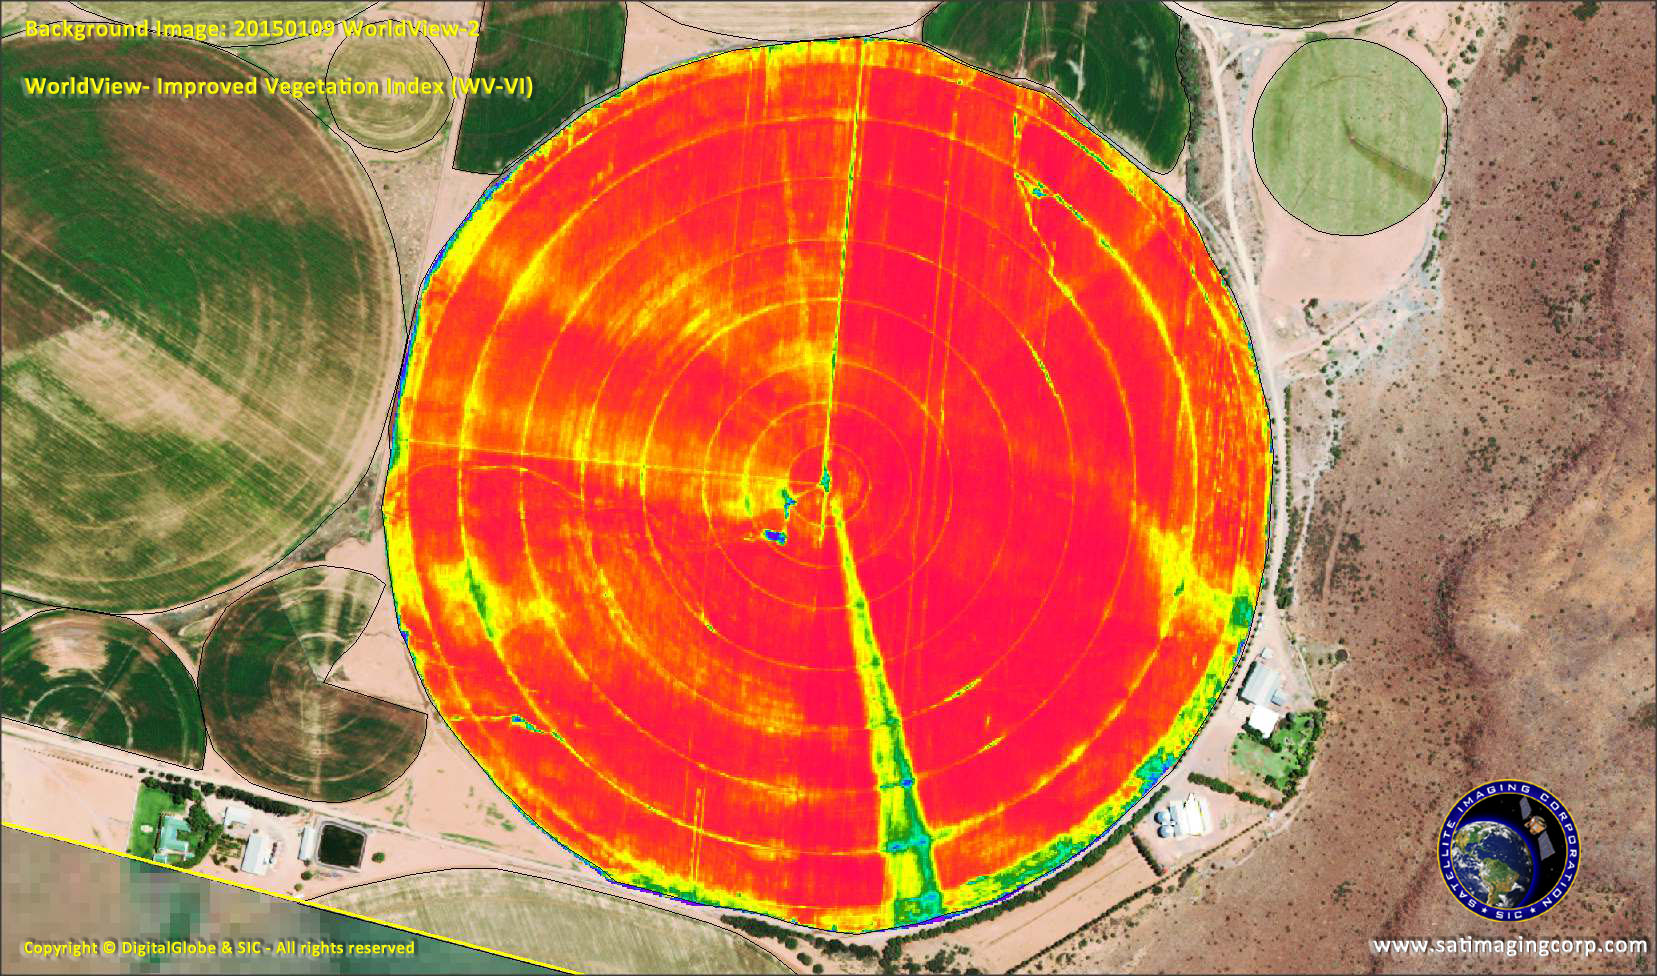
WorldView-2 MS 1.6m Google Earth™ KMZ
Maize Pivot / WV-VI Index, (Red High) 1.6m
Micro or Cube satellite constellations can provide daily, weekly or monthly satellite image data to deliver crop health and soil moisture information. The high-frequency satellite solutions provide critical insights to maximize yields and ensure crop health. Satellite imagery is available and very suitable for agriculture applications, thereby giving crop health, maximizing yield, and monitoring services for security, change detection, wildlife conservation, natural disasters, and many other applications.
Suppose you are interested in daily, weekly, monthly, or quarterly satellite imagery only, and vegetation, soil indices are not required. In that case, we can deliver imagery made available through a convenient API link. When vegetation indices on crop health and information of soil moisture conditions, preventing costly waterlogging problems, are required, these indices can be made available for download. Soil water data, vegetation water content, temperatures, and biomass information can be provided by utilizing Passive Satellite Microwave Sensing Technology, where cloud cover is not a problem.
This data is used in regional ArcGIS / ArcMap, QGIS or CAD management systems, and web portals. The ability of GIS to analyze and visualize agricultural environments and workflows has proven to be very beneficial to those involved in the farming industry.
When agriculture management software is not in place, vegetation and soil index imagery can be reviewed in Google Earth Pro™ for regional farmers to identify areas in the fields, requiring a closer analysis and deciding if additional crop irrigation or fertilization is required.
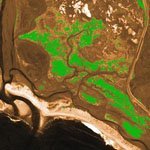
Xinavane – Mozambique Sugar Cane Plantation
Satellite Imagery 4-Band (RGBN) Spectral Image Data – KMZ
Click image to view animation
Normalized Difference Vegetation Index (NDVI) Scale Used
Background Image: Google Earth – © Google
To download various NDVI samples and save or open the KMZ file in Google Earth Pro™, please click on one of the links below:
The agriculture, forestry, and environmental industries are using the standard NDVI index for many years, but with the availability of multipectral sensors and high-resolution satellite sensors such as WorldView-2, WorldView-3, and Pleiades Neo utilizing an expanded multispectral surface reflectance range, SIC can provide a variety of vegetation indices to filter the correct band combinations for vegetation, soil, and environmental analysis to support crop, forest, and environmental project CV or GIS management.
| CCCI – Canopy chlorophyll content index CIRedEdge – Red-edge chlorophyll index CWSI – Crop water stress index GNDVI – Green normalized difference vegetative index LAI – Leaf area index MRESAVI – Modified RESAVI NDRE – Normalized difference red edge NDVI – Normalized difference vegetative index NNI – Nitrogen nutrition index OMNBR – Optimal multiple narrow-band reflectance index | OSAVI – Optimized soil-adjusted vegetation index REDVI – Red-edge difference vegetation index REIP – Red-edge inflation point RERDVI – Red-edge renormalized difference vegetation index RERVI – Red-edge ration vegetation index RESAVI – Red-edge soil-adjusted vegetation index RVI – Ration vegetation index SAVI – Soil-adjusted vegetation index TCARI – Transformed chlorophyll absorption reflection index WVVI – WorldView Improved Vegetation Index / Many more….. |
The vegation indices listed above and soil moisture/water indices, and custom made indices can be utilized in AI/ML algorithms assigned to the customer maximizing crop health and yield.
For more information on how SIC can assist, please Contact Us.
Managed Canopy Assessment
Copyright © DigitalGlobe. All rights reserved.
Vegetation and Soil Index Maps

Copyright © DigitalGlobe. All rights reserved.