Soil Zone Index

Discover what’s possible.

Get a complimentary consultation today.

Discover what’s possible.

Get a complimentary consultation today.

Looking in on the ground level

Ever wonder what’s going on at the soil surface? Without a clear view of the surface landscape, growers may be unaware of damaging irrigation or soil and waterlogging problems that ultimately will impact long-term production. Soil zone index is a product map that can see through vegetation to focus strictly on the soil surface. Soil zone maps give growers a ground-level view of their crops’ foundation with each image that’s collected.

Assessing the current condition of your soil

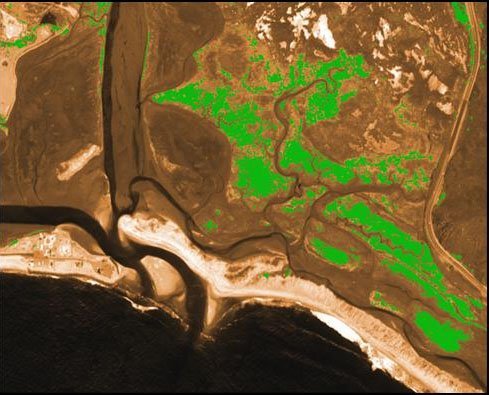
To develop a soil zone map, satellite images of your land are calibrated and then spectral algorithms are applied that isolate soil components from vegetation and provides a good indication on soil water conditions. The final satellite image shows what the soil surface of your field looks like, including irrigation patterns, sand streaks, clay lenses, and organic matter and crop residue variations. If the crop has less than 50 percent canopy cover, With a soil zone map, you can clearly see landscape variations. Lighter colors indicate dry, salty, or coarsely textured soils, while darker colors indicate wet or organic soils. Often, variations in color indicate topographic variations across fields, which can greatly impact your crop management strategies and zone creation for precision agriculture management applications.

QuickBird (0.6m) Satellite Image – Soil Index Map

Copyright © MAXAR. All rights reserved.

This information will help you adjust irrigation practices, determine where to take soil samples or place moisture sensors, and understand drainage, tilling or waterlogging problems. Additionally, because surface patterns can change during the growing season due to rainfall, tillage, or irrigation, these maps can be provided each time an image is collected. This gives you the most up-to-date data to determine how your crop is actually growing and provides more than one image to select from when making management decisions once the crop has been harvested. Machine Learning (ML), Artificial Intelligence (AI) algorithms and management systems can reduce the time the information becomes available and reduces the overall production cost, increase yield and produce3 a better harvest. 

View article on Agriculture Crop Management and Production Improved by Satellite Remote Sensing Technology and Geographic Information Systems (GIS)

Building a better foundation for your crops

By focusing on improving soil management during and after the growing season, growers can increase vegetation health and harvests.

Because these maps highlight soil patterns, you can alter existing irrigation, fertility, and production practices, making the most of the current season. Moreover, the maps are effective tools for determining where to sample soils and how to draw next season’s crop-management zones.

The soil zone information layer can be delivered through a dedicted API or used in a desktop GIS.

For more information on our products and services or for a consultation, please contact us.

Ready to get started?

Contact us for a custom imagery solution or request a quote

TESTIMONIALS

Stories & Experiences

Lorem ipsum dolor sit amet, consectetur adipiscing elit, sed do eiusmod tempor incididunt ut labore et dolore magna aliqua. Ut enim ad minim veniam, quis nostrud exercitation. .

FAQ’S

Frequently Asked Questions

How to find Geographic Coordinates in Google maps?

To find geographic coordinates in Google Maps, you can follow these steps:

  1. Open Google Maps in your web browser or on your mobile device.

  2. Search for the location you want to find the geographic coordinates for by entering the address, landmark, or name of the place in the search bar at the top of the page.

  3. Once the location is displayed on the map, right-click (or long-press on mobile) the exact point on the map where you want to find the coordinates. This will open a small menu.

  4. In the menu that appears, click on “What’s here?” or “What’s here? – Coordinates” option. On mobile devices, you may need to tap on the location marker first to reveal the menu options.

  5. A small information box will appear at the bottom of the screen, displaying the latitude and longitude coordinates of the selected point. The coordinates will be shown in decimal degrees format.

  6. You can click on the coordinates in the information box to expand it and see the coordinates in different formats, such as degrees, minutes, and seconds (DMS) or Universal Transverse Mercator (UTM) format.

To create a KML (Keyhole Markup Language) file in Google Earth, you can follow these steps:

  1. Download Google Earth Pro and Open on your computer.

  2. Navigate to the location or area you want to create a KML file for by using the search bar, zooming in/out, and panning on the map.

  3. Customize the view and layers in Google Earth Pro to include the specific data or elements you want to include in your KML file. This can include placemarks, paths, polygons, overlays, images, and more.

  4. Once you have set up the desired view and layers, go to the “Add” menu at the top of the screen and select the type of element you want to add (e.g., placemark, path, polygon, image overlay).

  5. Follow the prompts to add the specific element and provide the necessary information, such as location coordinates, name, description, and any additional properties or styling options.

  6. Repeat the previous step if you want to add more elements to your KML file.

  7. After adding all the desired elements, go to the “File” menu and select “Save Place As.”

  8. In the “Save Place As” dialog box, choose a location on your computer where you want to save the KML file.

  9. Specify the name of the KML file, ensuring it has the .kml extension (e.g., myfile.kmL), you may need to select KML as GoogleEarth defaults to KMZ formats.

  10.  Click the “Save” button to save the KMZ file to the specified location on your computer.

Ordering commercial high-resolution and medium-resolution satellite maps process:

  1. Identify your requirements: Determine the specific needs for the satellite maps, including the desired resolution, geographic coverage, acquisition date, and any additional specifications such as spectral bands or cloud cover constraints.

  2. Contact Us: Reach out to us to inquire about our imaging product and services. Provide us with the details of your requirements, including the area of interest, resolution, and any other specifications.

  3. If there is high urgency for imagery, please let us know that this is a time sensitive project. Any project deadlines should be included with your initial contact.

  4. Request a quote: Ask for a formal quote for the satellite maps you need. The quote should include information such as the cost, delivery timeline, licensing terms, and any additional services like data processing or analysis.

  5. Review the quote: Evaluate the quote provided by us and if needed, we can negotiate the terms, pricing, or any specific requirements that may not be fully covered.

  6. Confirm the order: Once you are satisfied with the quote and have reached an agreement, confirm your order. We will guide you through the necessary steps for payment and delivery.

  7. Receive the satellite maps: After the order is confirmed and payment is processed, you will receive the satellite map data in the specified format. This may include downloading the data from a secure portal or receiving physical media, depending on delivery method.

  8. Utilize the satellite maps: With the satellite maps that you receive, you can utilize it for your intended purposes, such as GIS data, 3D terrain maps, disaster, geospatial data, and other applications as needed.

Satellite map raw files refer to the unprocessed and unedited data captured by satellite sensors. These files contain the raw data received by the satellite sensors, including the reflected or emitted electromagnetic radiation from the Earth’s surface.

Satellite map raw files typically come in specialized formats specific to each satellite sensor or provider. These formats may include formats like GeoTIFF (georeferenced Tagged Image File Format) or ENVI (Environment for Visualizing Images). The raw files preserve the original sensor readings, which can include various spectral bands, radiometric information, and geometric parameters.

Raw files require processing to convert them into usable formats, such as georeferenced images or digital elevation model(DEM). Processing steps may involve radiometric and geometric corrections, atmospheric compensation, calibration, orthorectification, and mosaicking, among others.

Once processed, raw files can provide valuable information for various GIS data applications, including 3D terrain maps, agriculture production maps, vegetation maps, and disaster maps.

To download satellite maps from an FTP (File Transfer Protocol) server, you can follow these general steps:

  1. Obtain the FTP server information: Get the FTP server details from the satellite maps provider or the source you are accessing. This includes the FTP server address, username, password, and potentially the directory path to the imagery files.

  2. Choose an FTP client: Select an FTP client software or application that allows you to connect to the FTP server and perform file transfers. Some popular options include FileZilla, WinSCP, Cyberduck, or the built-in FTP functionality of certain web browsers.

  3. If you are unable to download an FTP client due to software locks, Windows has a built in FTP Protocol that can be accessed by copying the URL of the FTP server in your Windows File Explorer.

  4. Depending on the method to connect to the FTP, you will need credentials including a Username and Password to access these file.

  5. Most FTP clients will allow you to Copy and Paste or Drag and Drop the files from the client window to your local files.

Remember to comply with any terms and conditions associated with the satellite map data, including usage restrictions, licensing agreements, and any attribution requirements specified by the provider.

For any other questions or for a consultation, please contact us.

Scroll to Top