Mapas del índice de vegetación ES

Discover what’s possible.

Get a complimentary consultation today.

Discover what’s possible.

Get a complimentary consultation today.

ÍNDICE DE VEGETACIÓN VERDE:

UN MAPA DE LA SALUD DE LA VEGETACIÓN

Tomando mejores decisiones más rápidamente

Teniendo que considerar las variables del tiempo, medio ambiente y producción, la única cosa con la que los agricultores pueden contar es la incertidumbre. El tener una información integral actualizada de cada campo es crucial para optimizar sus estrategias de administración de cultivo en la estación.

Elementos centrales de la línea de productos AgroWatch™, los mapas de Índices de vegetación verde son imágenes detalladas que dan a los agricultores una medida absoluta de la cantidad de vegetación verde presente en sus campos. Estos mapas muestran los resultados integrados de datos de entrada y factores ambientales, físicos y culturales que afectan su cultivo. Con nuestros datos calibrados, usted puede evaluar la cantidad de vegetación de forma rutinaria y cuantitativamente, el estado y variación en sus tierras desde suelo desnudo a una densa cubierta forestal, para administrar mejor sus cultivos esta estación e ir hacia atrás en el tiempo para identificar factores limitadores de rendimiento.

El captar perspectivas generales de grandes áreas de producción con una resolución de detalle de 30 pies, los mapas de Vegetación verde de AgroWatch™ también muestran tendencias a través de múltiples granjas. Para realzar sus decisiones en la estación, el programa de imágenes recoge datos a horas predefinidas y le entrega los mismos a usted en Internet en casi tiempo real. Los mapas de Vegetación verde son una importante herramienta realzadota de ingresos que le muestra dónde explorar y tomar muestras, el grado y severidad de áreas problemáticas y dónde aplicar datos de entrada, productos de protección de cultivos, reguladores de crecimiento o exfoliantes.

Una medida estandarizada del estado de los asuntos

Los mapas de Índice de vegetación verde AgroWatch™ le proporcionan una imagen completa y precisa de la cantidad de vegetación y variabilidad sin errores causados por el suelo y la humedad. Para crear un mapa de Índice de vegetación verde utilizando la tecnología de detección remota, Imágenes satelitales de alta resolución recogidas por sensores satelitales como GeoEye-1, WorldView-2, Pleiades-1, QuickBird, IKONOS y SPOT-6, son calibradas usando sus cultivos y se aplican algoritmos espectrales especialmente desarrollados para separar la reflectancia de la vegetación de la variación causada por suelos o agua subyacente. Al ofrecer una perspectiva transparente del estado actual de sus cultivos, el Índice de vegetación verde es una medida repetible que puede aplicarse consistentemente a través de varios escenarios, lugares de muestra e intervalos de tiempo. Agricultores, consultores y científicos pueden relacionar fácilmente el Índice de vegetación verde con medidas de vegetación estándar en la industria, tales como el índice del área de hojas verdes, altura de plantas, biomasa o porcentaje de cubierta forestal.

El resultado final es datos cuantificables que muestran el estado vegetativo de cada campo que usted puede usar para identificar tendencias locales, regionales o mundiales, rápida y exactamente. Puesto que los mapas están calibrados, pueden usarse para generar mapas de aplicación o bien en paquetes GIS de escritorio o a través de soluciones en línea suministradas por Satellite Imaging Corporation.
Ver donde no puede caminar

El Índice de vegetación verde AgroWatch™ es único en su habilidad de ayudar a usuarios a detectar problemas potenciales en cultivos densos en los que no puede caminar. Otros índices no pueden medir diferencias vegetativas una vez que la cubierta de cultivo cubre el suelo. Con el Índice de vegetación verde AgroWatch™ usted puede ver lo que está sucediendo en áreas a las que no tiene acceso. Con la ayuda de mapas de Índice de vegetación verde, agricultores, gerentes, asesores y consultores están tomando decisiones de cultivo más rápidamente, mejorando la calidad del cultivo y aumentando la productividad.

Índice de vegetación verd — De un vistazo

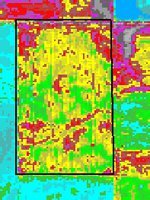
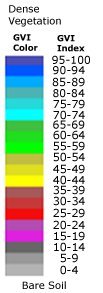
Qué: Mapas de color codificados muestran la cantidad de vegetación verde, variaciones en densidad de vegetación y la salud general de la planta. El color gris indica el suelo desnudo. La densidad de vegetación aumenta a medida que el color cambia de rojo a amarillo y a verde. Los colores azules indican la vegetación más den

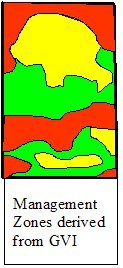
Usos: El Índice de vegetación verde AgroWatch™ muestra variaciones en un campo o región rápida y cuantitativamente, el grado de severidad de problemas que afectan al crecimiento vegetativo y dónde tomar muestras. Cuando se desee, el mapa GVI puede usarse para crear zonas de administración o mapas de Aplicación a Ritmo Variable (VRA por sus siglas en inglés).

Beneficio: Es más rápido, le ayuda a tomar mejores decisiones y reduce su compromiso de tiempo. Los usuarios de este producto pueden reducir su tiempo en cada campo al menos en un 30% mientras mejoran los resultados y aumentan las comunicaciones con los clientes.

AgroWatch™ es una marca registrada de DigitalGlobe.

SIC está disponible para consultoría de todas las necesidades y especificaciones de su proyecto. Usted puede contactarnos por Internet o telefoneando al +1 (832) 237-2900.

Ready to get started?

Contact us for a custom imagery solution or request a quote

TESTIMONIALS

Stories & Experiences

Lorem ipsum dolor sit amet, consectetur adipiscing elit, sed do eiusmod tempor incididunt ut labore et dolore magna aliqua. Ut enim ad minim veniam, quis nostrud exercitation. .

FAQ’S

Frequently Asked Questions

How to find Geographic Coordinates in Google maps?

To find geographic coordinates in Google Maps, you can follow these steps:

  1. Open Google Maps in your web browser or on your mobile device.

  2. Search for the location you want to find the geographic coordinates for by entering the address, landmark, or name of the place in the search bar at the top of the page.

  3. Once the location is displayed on the map, right-click (or long-press on mobile) the exact point on the map where you want to find the coordinates. This will open a small menu.

  4. In the menu that appears, click on “What’s here?” or “What’s here? – Coordinates” option. On mobile devices, you may need to tap on the location marker first to reveal the menu options.

  5. A small information box will appear at the bottom of the screen, displaying the latitude and longitude coordinates of the selected point. The coordinates will be shown in decimal degrees format.

  6. You can click on the coordinates in the information box to expand it and see the coordinates in different formats, such as degrees, minutes, and seconds (DMS) or Universal Transverse Mercator (UTM) format.

To create a KML (Keyhole Markup Language) file in Google Earth, you can follow these steps:

  1. Download Google Earth Pro and Open on your computer.

  2. Navigate to the location or area you want to create a KML file for by using the search bar, zooming in/out, and panning on the map.

  3. Customize the view and layers in Google Earth Pro to include the specific data or elements you want to include in your KML file. This can include placemarks, paths, polygons, overlays, images, and more.

  4. Once you have set up the desired view and layers, go to the “Add” menu at the top of the screen and select the type of element you want to add (e.g., placemark, path, polygon, image overlay).

  5. Follow the prompts to add the specific element and provide the necessary information, such as location coordinates, name, description, and any additional properties or styling options.

  6. Repeat the previous step if you want to add more elements to your KML file.

  7. After adding all the desired elements, go to the “File” menu and select “Save Place As.”

  8. In the “Save Place As” dialog box, choose a location on your computer where you want to save the KML file.

  9. Specify the name of the KML file, ensuring it has the .kml extension (e.g., myfile.kmL), you may need to select KML as GoogleEarth defaults to KMZ formats.

  10.  Click the “Save” button to save the KMZ file to the specified location on your computer.

Ordering commercial high-resolution and medium-resolution satellite maps process:

  1. Identify your requirements: Determine the specific needs for the satellite maps, including the desired resolution, geographic coverage, acquisition date, and any additional specifications such as spectral bands or cloud cover constraints.

  2. Contact Us: Reach out to us to inquire about our imaging product and services. Provide us with the details of your requirements, including the area of interest, resolution, and any other specifications.

  3. If there is high urgency for imagery, please let us know that this is a time sensitive project. Any project deadlines should be included with your initial contact.

  4. Request a quote: Ask for a formal quote for the satellite maps you need. The quote should include information such as the cost, delivery timeline, licensing terms, and any additional services like data processing or analysis.

  5. Review the quote: Evaluate the quote provided by us and if needed, we can negotiate the terms, pricing, or any specific requirements that may not be fully covered.

  6. Confirm the order: Once you are satisfied with the quote and have reached an agreement, confirm your order. We will guide you through the necessary steps for payment and delivery.

  7. Receive the satellite maps: After the order is confirmed and payment is processed, you will receive the satellite map data in the specified format. This may include downloading the data from a secure portal or receiving physical media, depending on delivery method.

  8. Utilize the satellite maps: With the satellite maps that you receive, you can utilize it for your intended purposes, such as GIS data, 3D terrain maps, disaster, geospatial data, and other applications as needed.

Satellite map raw files refer to the unprocessed and unedited data captured by satellite sensors. These files contain the raw data received by the satellite sensors, including the reflected or emitted electromagnetic radiation from the Earth’s surface.

Satellite map raw files typically come in specialized formats specific to each satellite sensor or provider. These formats may include formats like GeoTIFF (georeferenced Tagged Image File Format) or ENVI (Environment for Visualizing Images). The raw files preserve the original sensor readings, which can include various spectral bands, radiometric information, and geometric parameters.

Raw files require processing to convert them into usable formats, such as georeferenced images or digital elevation model(DEM). Processing steps may involve radiometric and geometric corrections, atmospheric compensation, calibration, orthorectification, and mosaicking, among others.

Once processed, raw files can provide valuable information for various GIS data applications, including 3D terrain maps, agriculture production maps, vegetation maps, and disaster maps.

To download satellite maps from an FTP (File Transfer Protocol) server, you can follow these general steps:

  1. Obtain the FTP server information: Get the FTP server details from the satellite maps provider or the source you are accessing. This includes the FTP server address, username, password, and potentially the directory path to the imagery files.

  2. Choose an FTP client: Select an FTP client software or application that allows you to connect to the FTP server and perform file transfers. Some popular options include FileZilla, WinSCP, Cyberduck, or the built-in FTP functionality of certain web browsers.

  3. If you are unable to download an FTP client due to software locks, Windows has a built in FTP Protocol that can be accessed by copying the URL of the FTP server in your Windows File Explorer.

  4. Depending on the method to connect to the FTP, you will need credentials including a Username and Password to access these file.

  5. Most FTP clients will allow you to Copy and Paste or Drag and Drop the files from the client window to your local files.

Remember to comply with any terms and conditions associated with the satellite map data, including usage restrictions, licensing agreements, and any attribution requirements specified by the provider.

For any other questions or for a consultation, please contact us.

Scroll to Top